Your First Experiment
In this tutorial, you will go through a complete workflow: loading a demo dataset, segmenting cells, tracking them, and visualizing the results.
Note
Prerequisites: Ensure you have installed Celldetective following the Get Started guide.
Step 1: Get the demo data
We have a built-in shortcut to download a demo dataset (Spreading Assay).
Open your terminal and run:
$ python -m celldetective
In the startup window’s menu bar, go to File > Open Demo > Spreading Assay Demo.
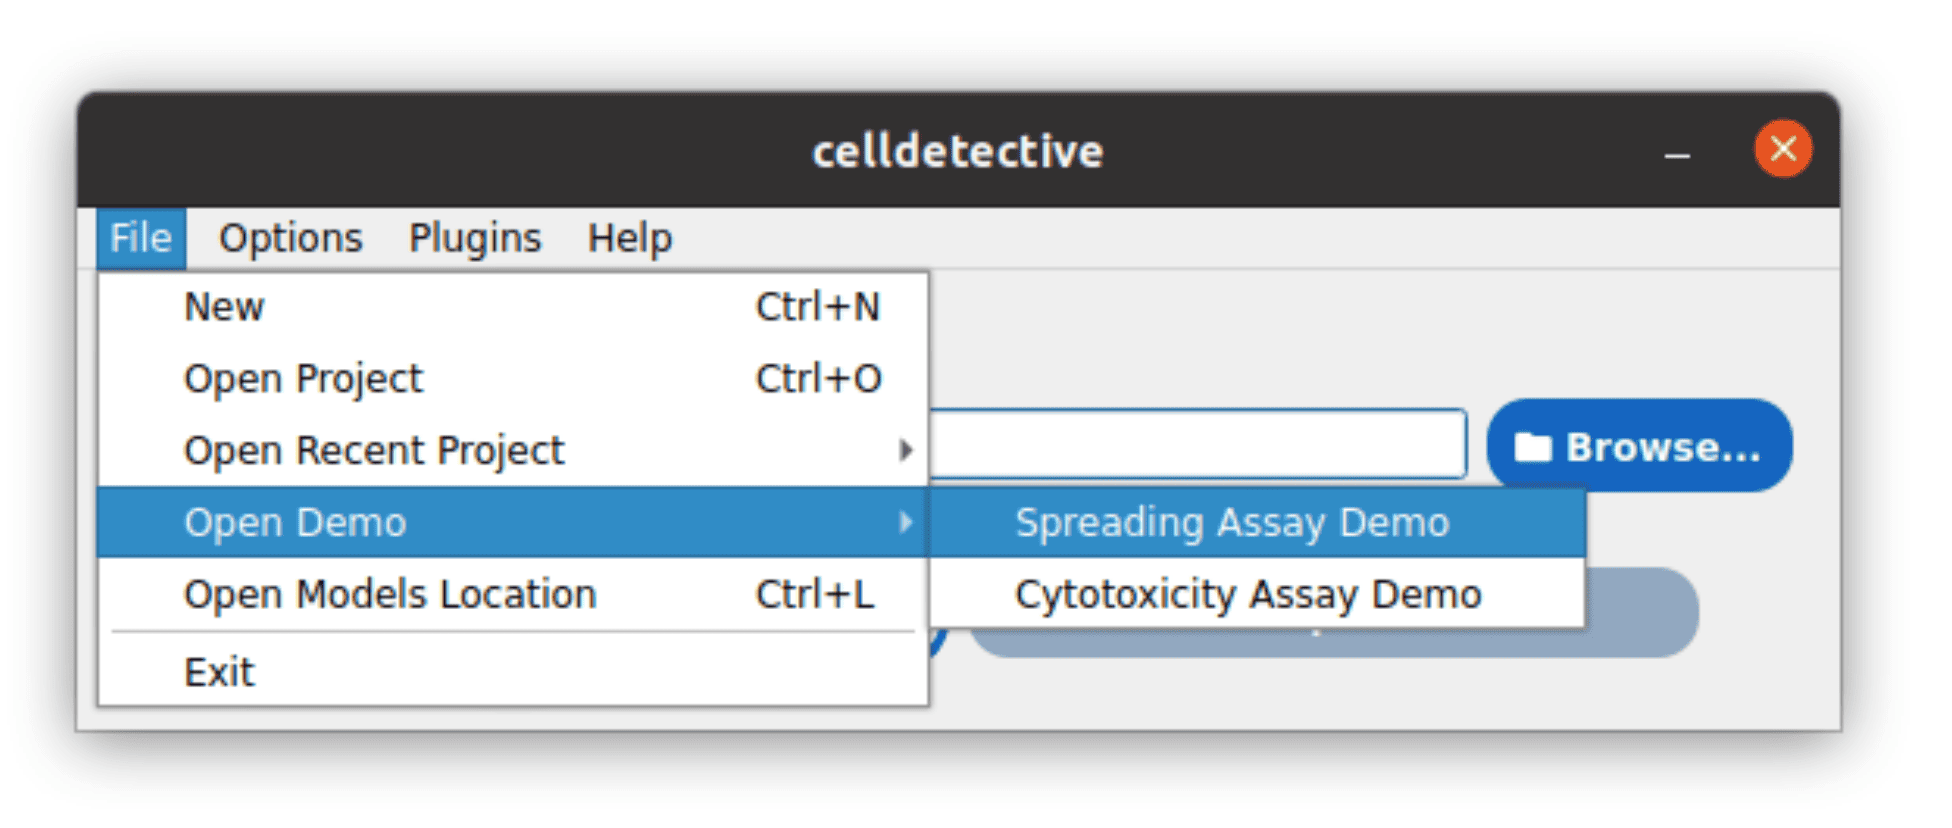
Select a folder where you want to save the data.
The software will download the
demo_ricmdataset and automatically load it.
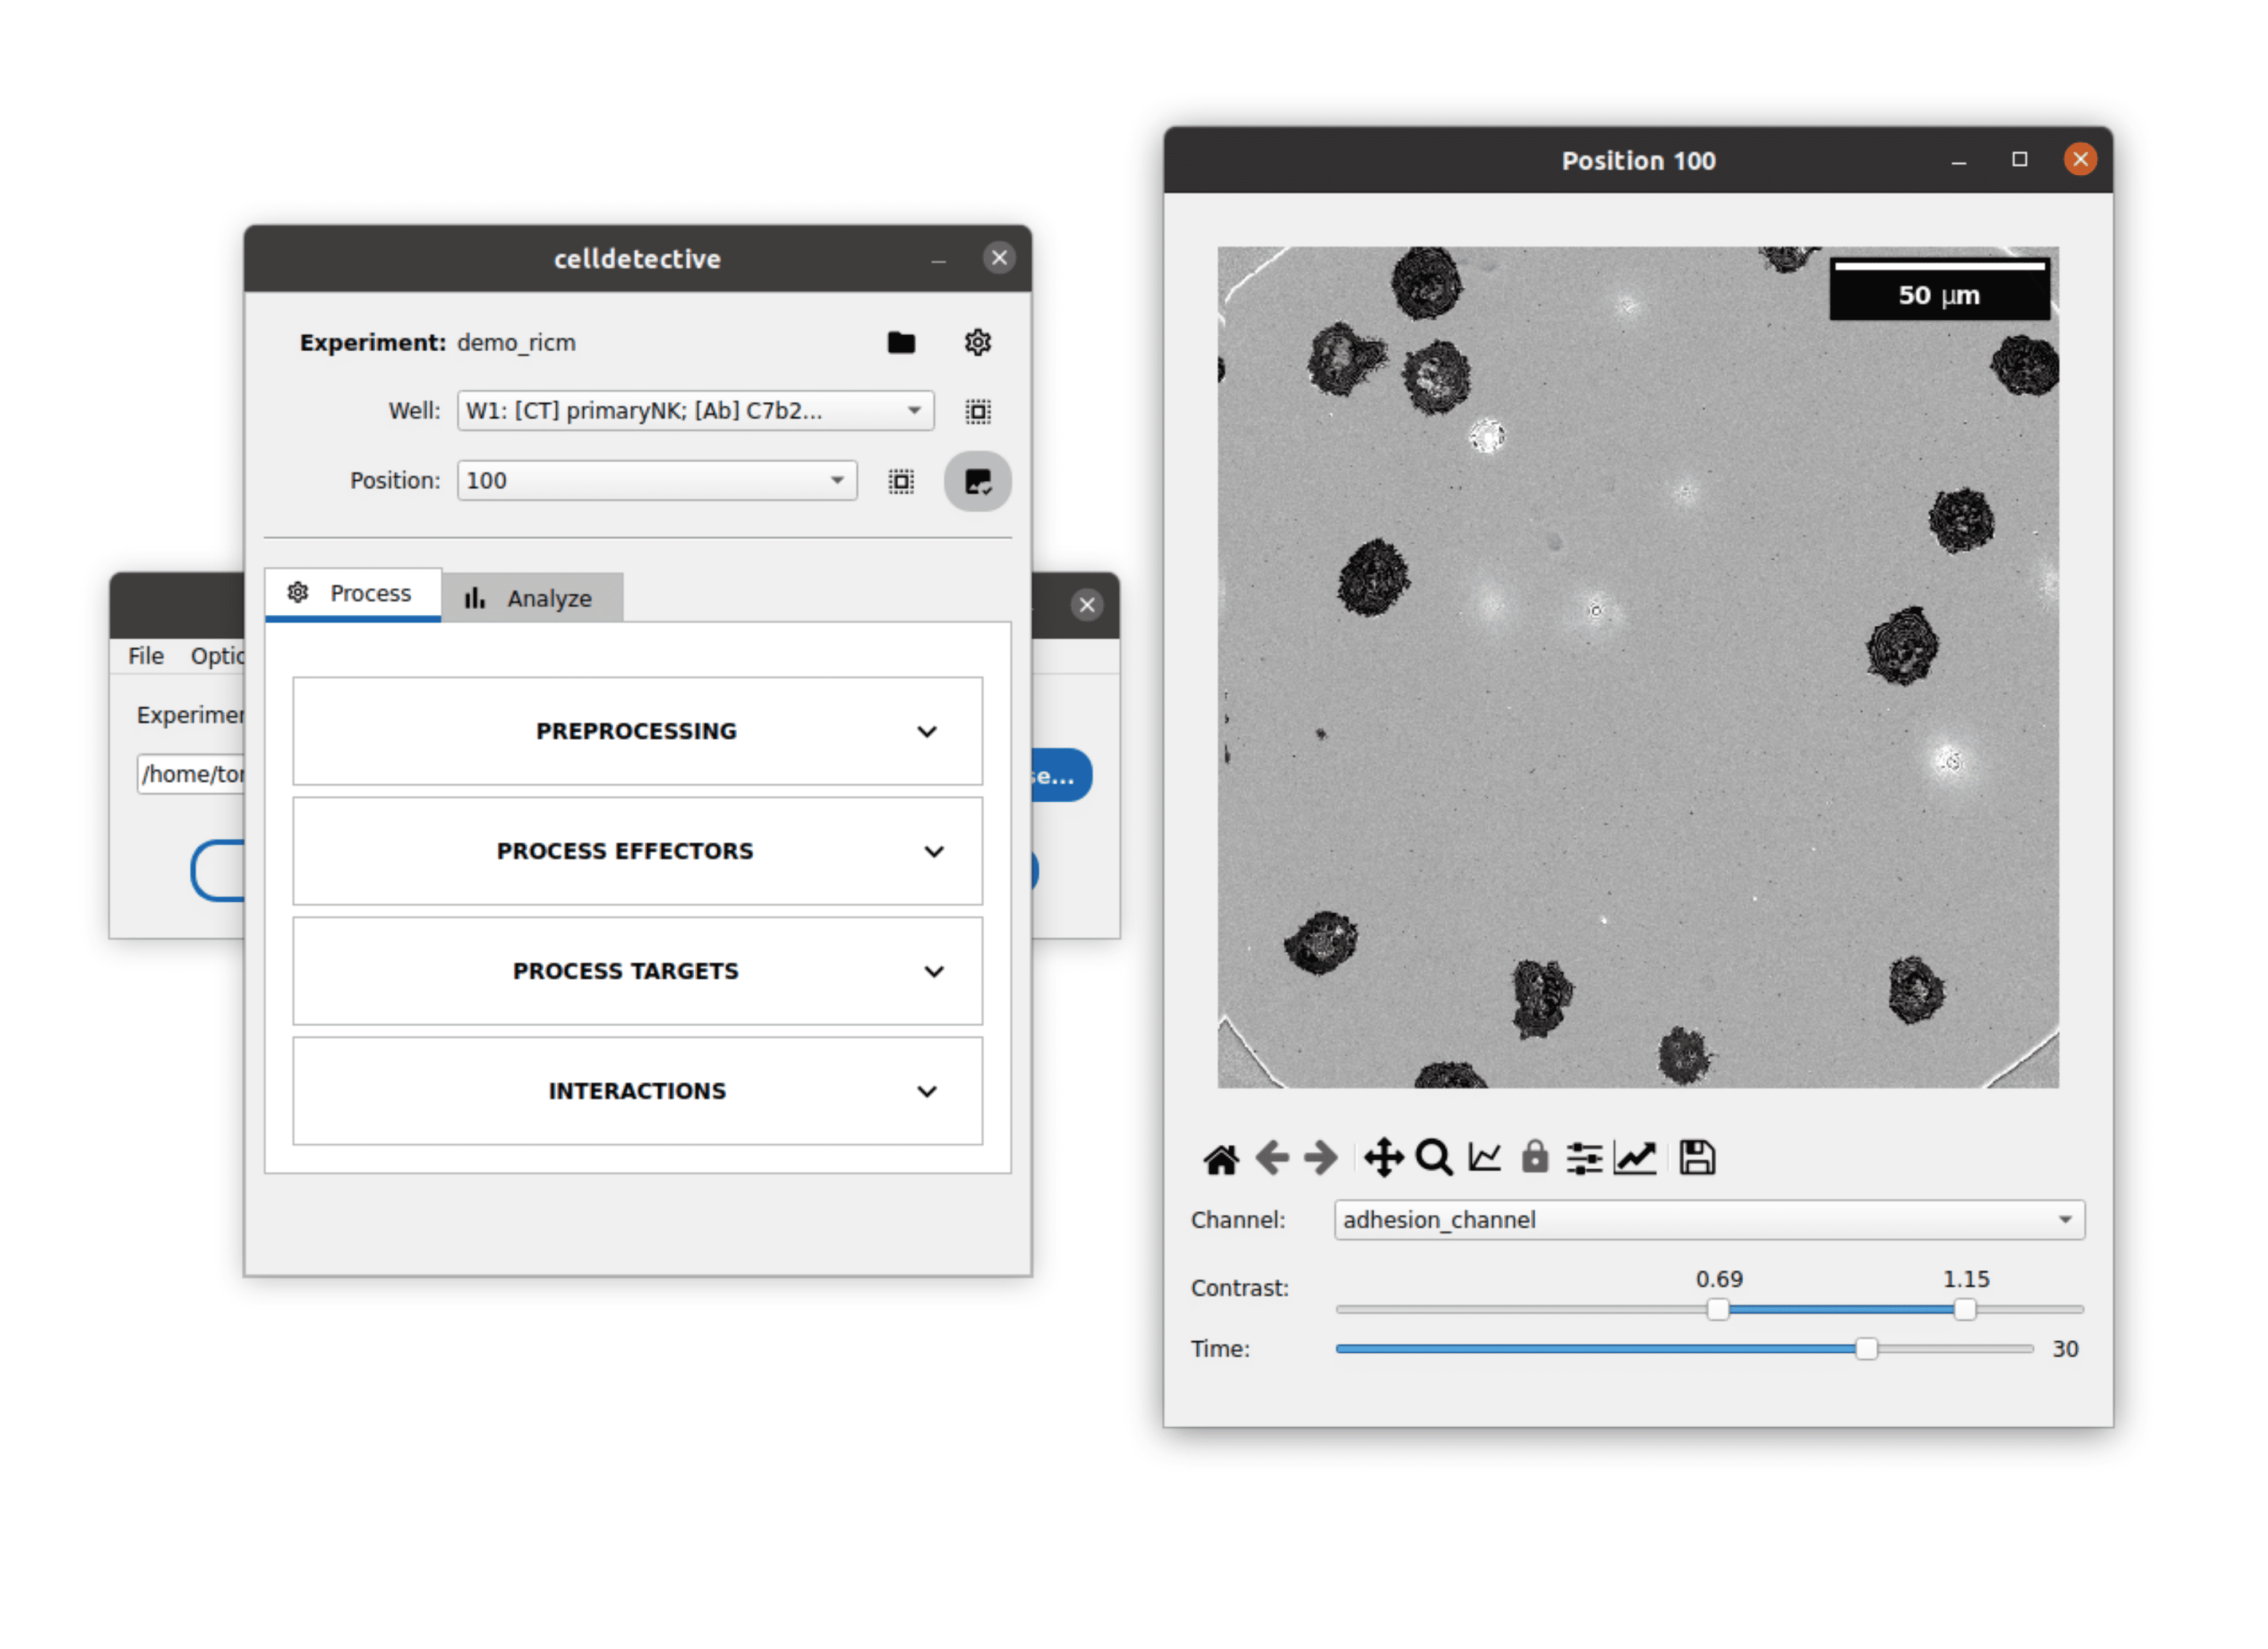
Explore the data contained in the Spreading Assay Experiment Demo
Step 2: Segment Cells
Now we will detect the cells in the images. The demo dataset contains images of immune cells spreading on a surface mimicking an antigen presenting cell.
Locate the Process Effectors block in the processing panel and expand it.
Check the Segment box.
In the Model zoo dropdown, select lymphocytes_ricm.
Click Submit to run segmentation.
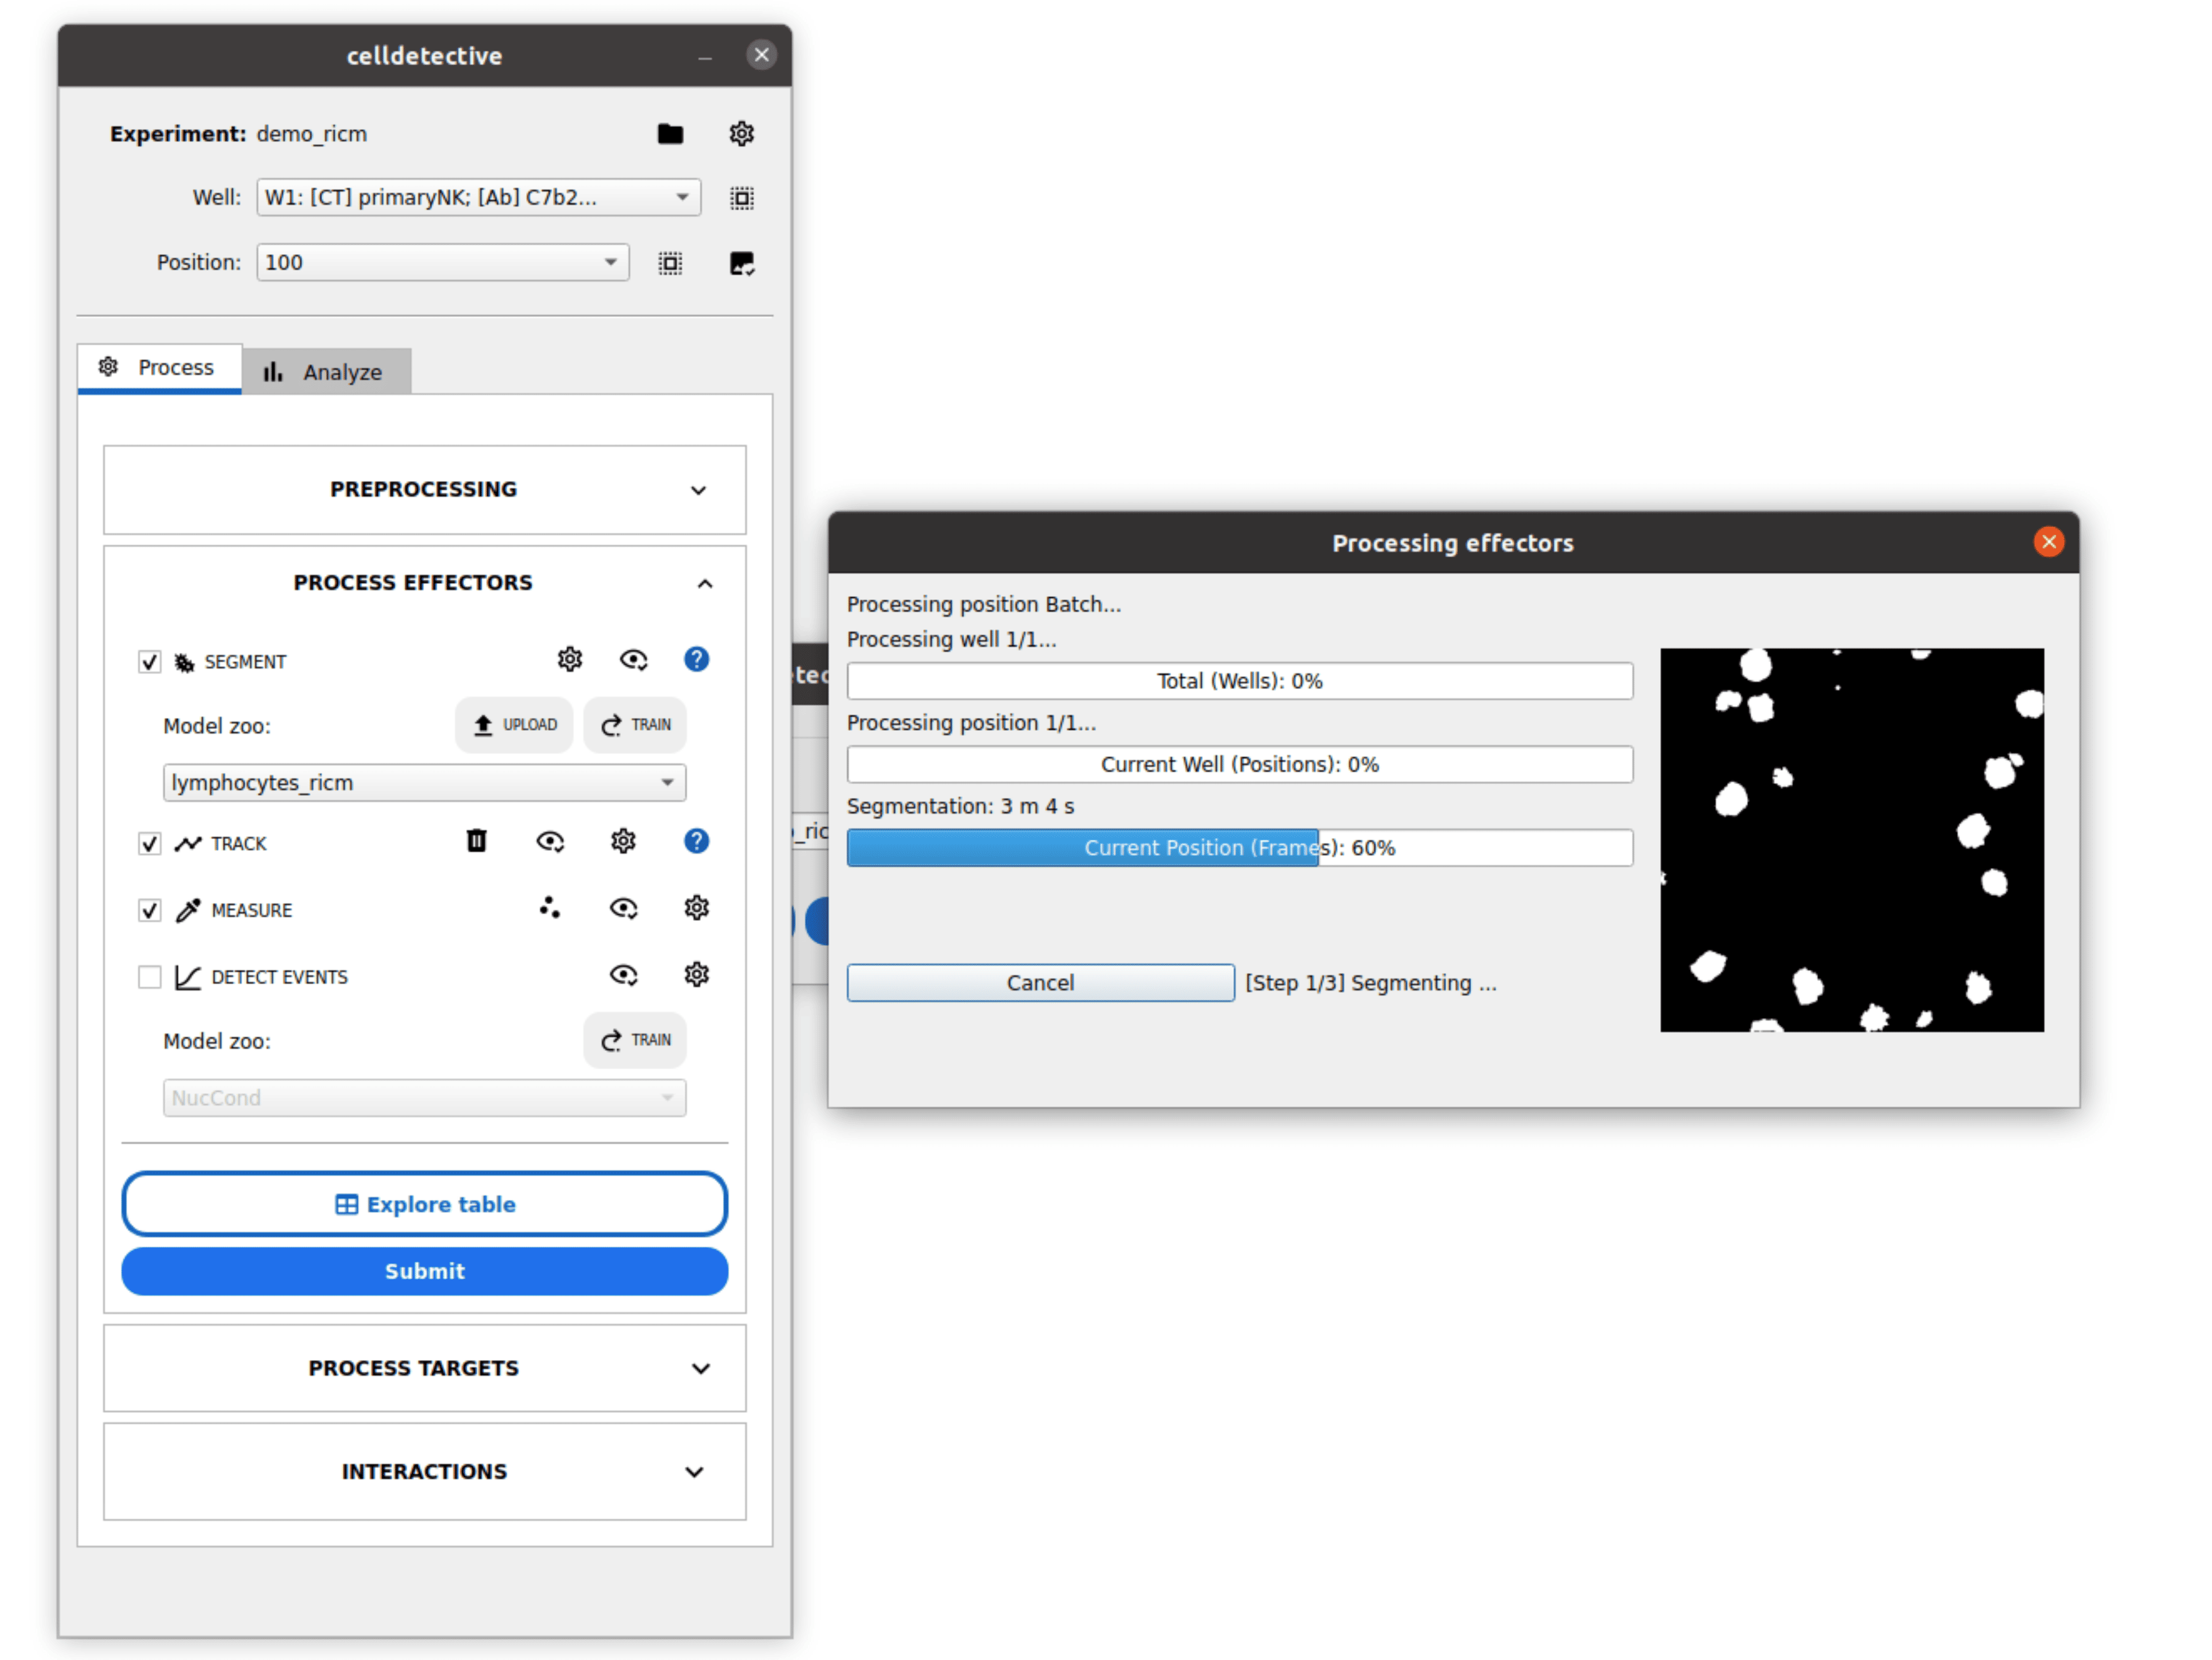
The progress windows shows you segmentation masks as they are produced
Tip
You can visualize and correct the segmentation results by clicking the button next to the segmentation entry. This opens napari with the image and mask layers.
Step 3: Track Cells
Once cells are segmented for each frame, we can link them over time.
Check the TRACK option.
Click the button next to it.
Select trackpy in the tracking options.
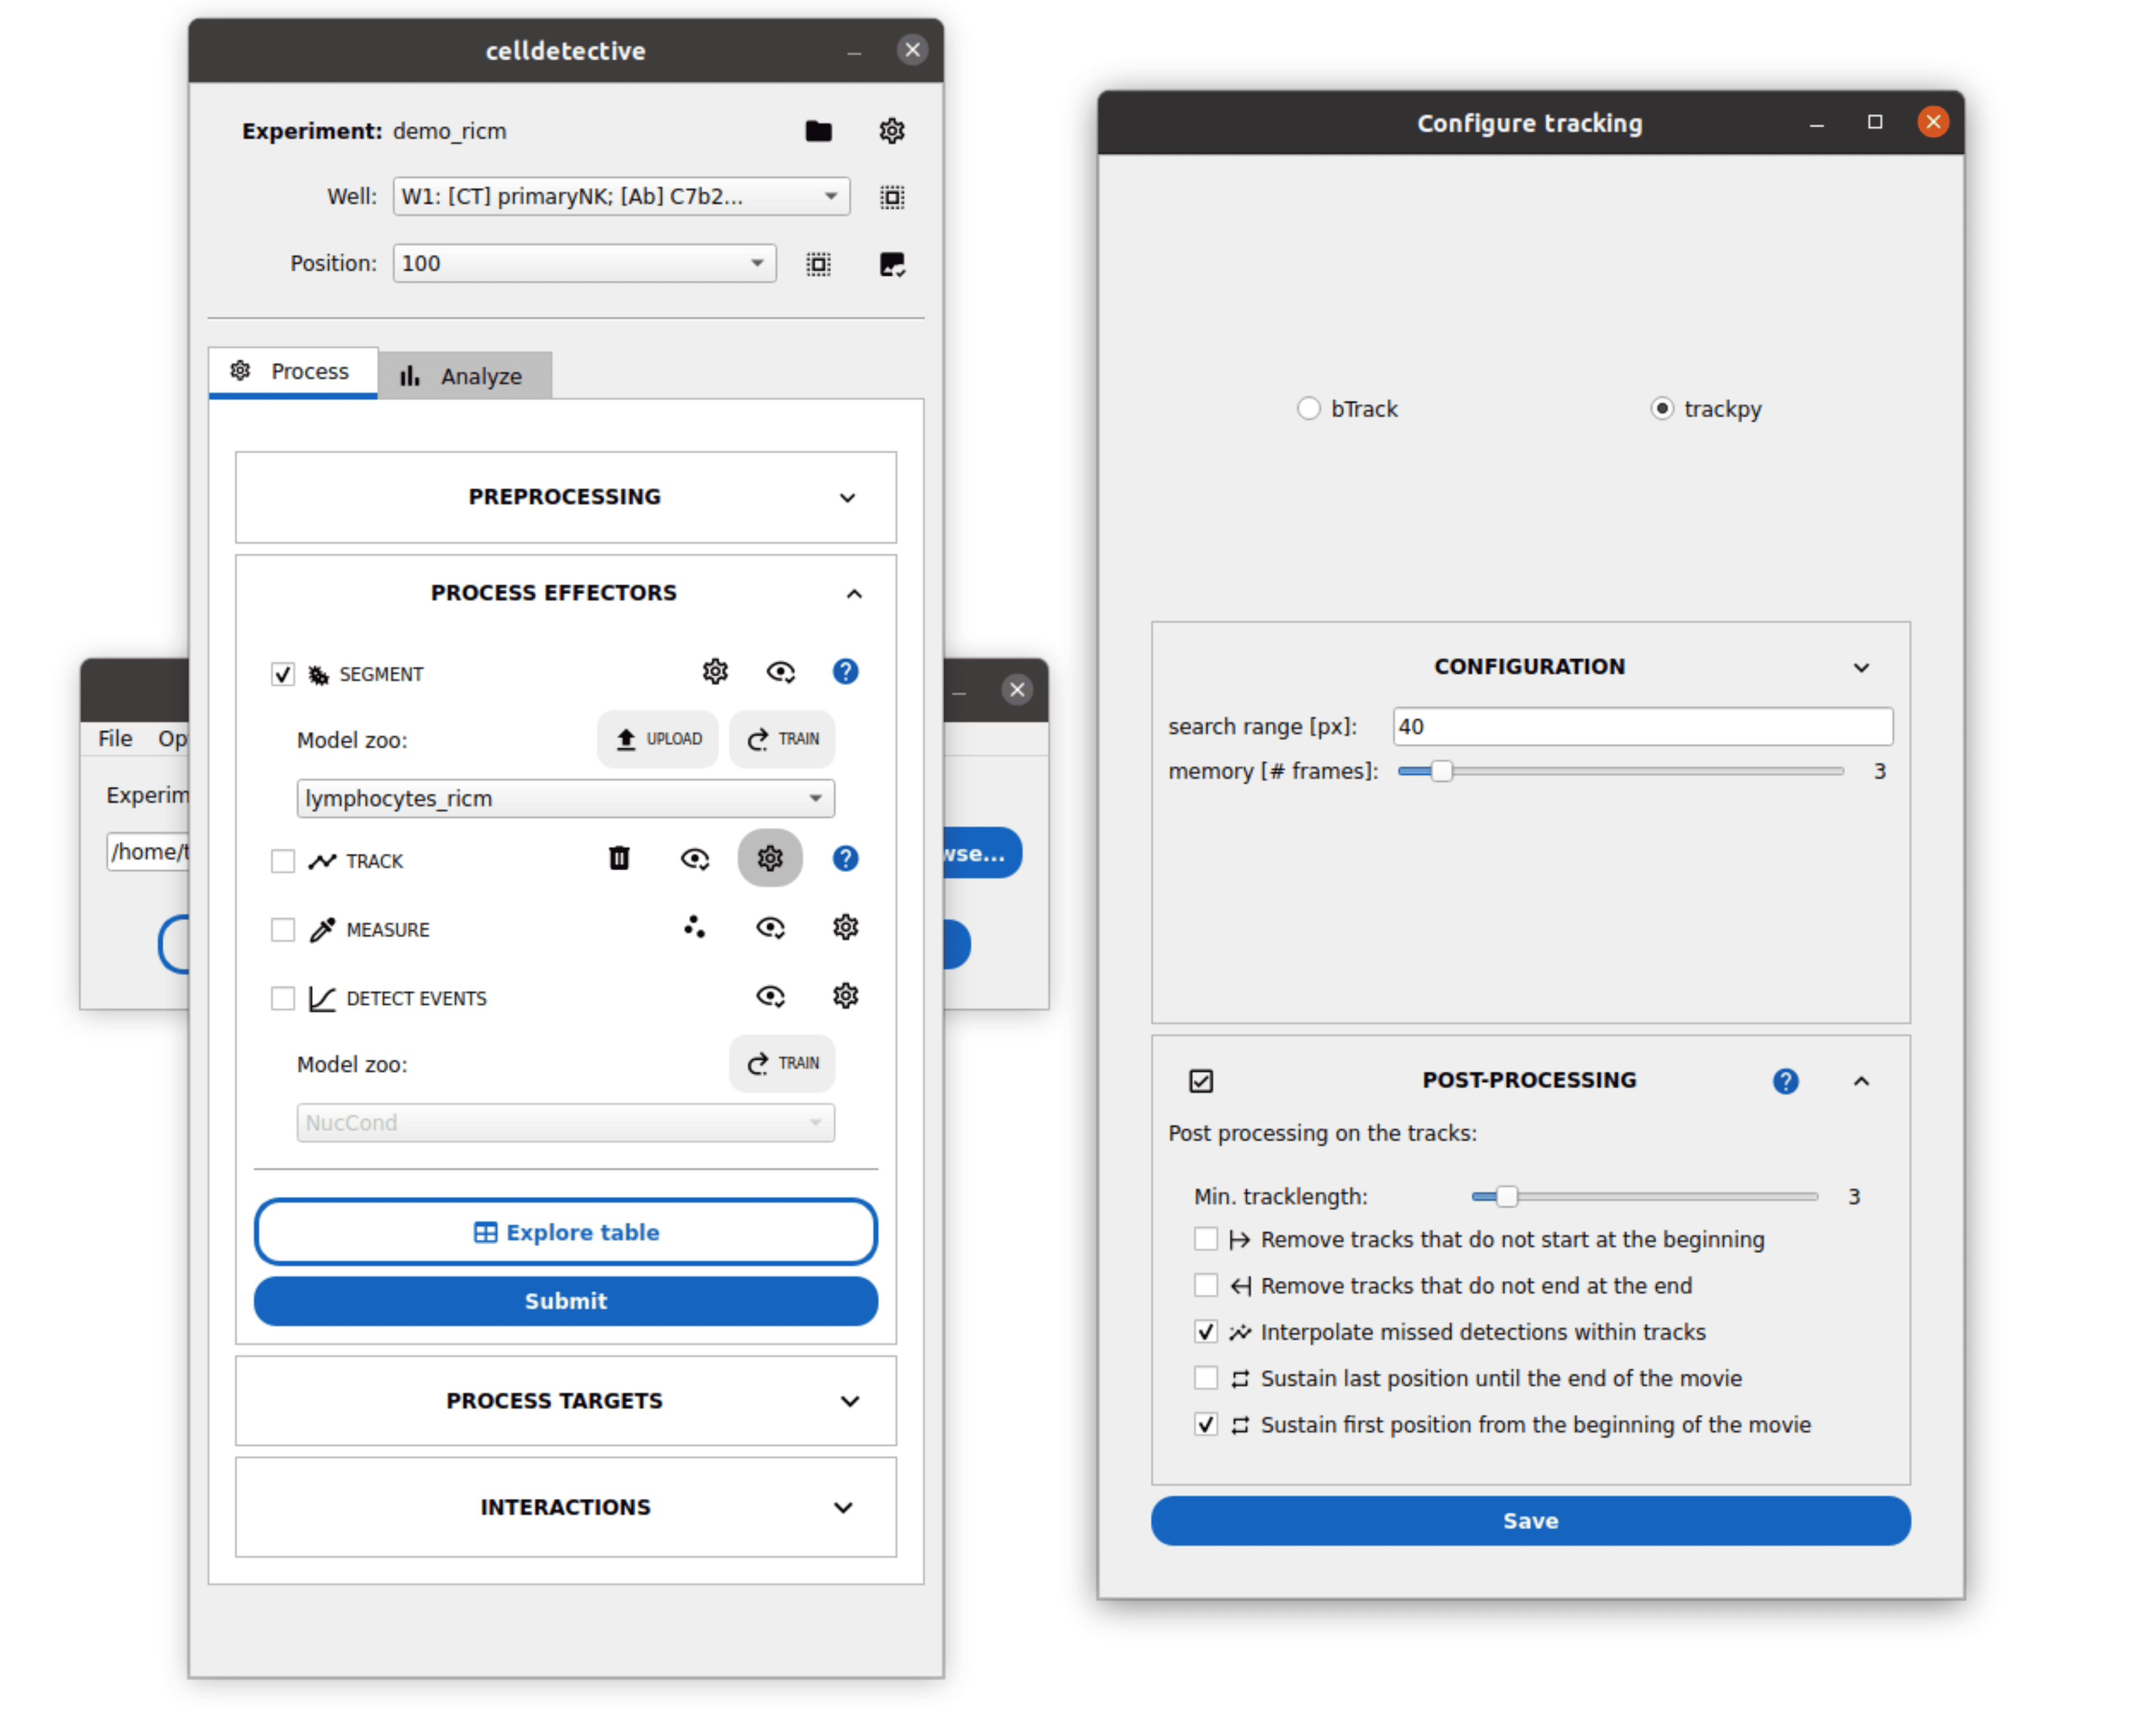
Press Save to close the configuration window and click Submit.
The software will link detections frame-by-frame and generate a trajectories table per position (here, only one).
Step 4: Measure Features
To analyze cellular dynamics, we need to extract quantitative features.
Check the MEASURE option.
Click the button next to it.
Ensure
areaandintensity_meanare listed in the features list.Press Save to close the configuration window and click Submit.
Celldetective will measure these features for every cell at every time point.
Step 5: Analyze Time-Series
This is the core of Celldetective: analyzing how single-cell features change over time.
Scroll to the DETECT EVENTS section.
Click the button (Event Annotator) to open the interactive viewer.
Click on any cell in the movie (the circle marker will turn green).
The panel on the left displays its feature time-series (e.g.,
areavsFRAME).
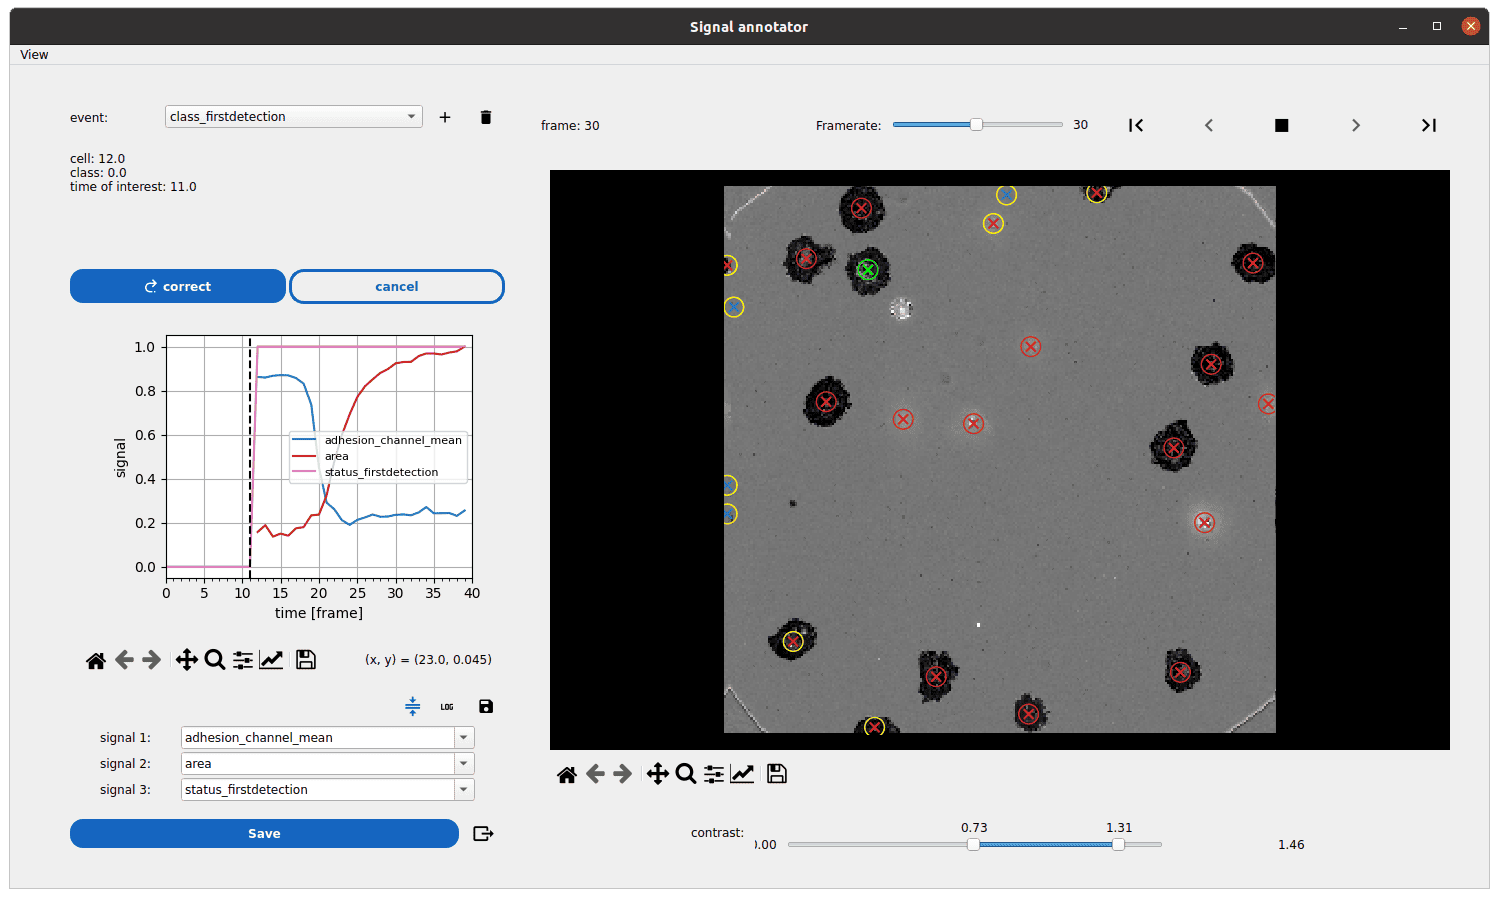
Exploring the first detection single-cell event
Detect Spreading Events: In this demo, cells become dark (low intensity) when they spread. Let’s annotate this using the Classifier Widget:
In the MEASURE section, click the button (Classifier Widget).
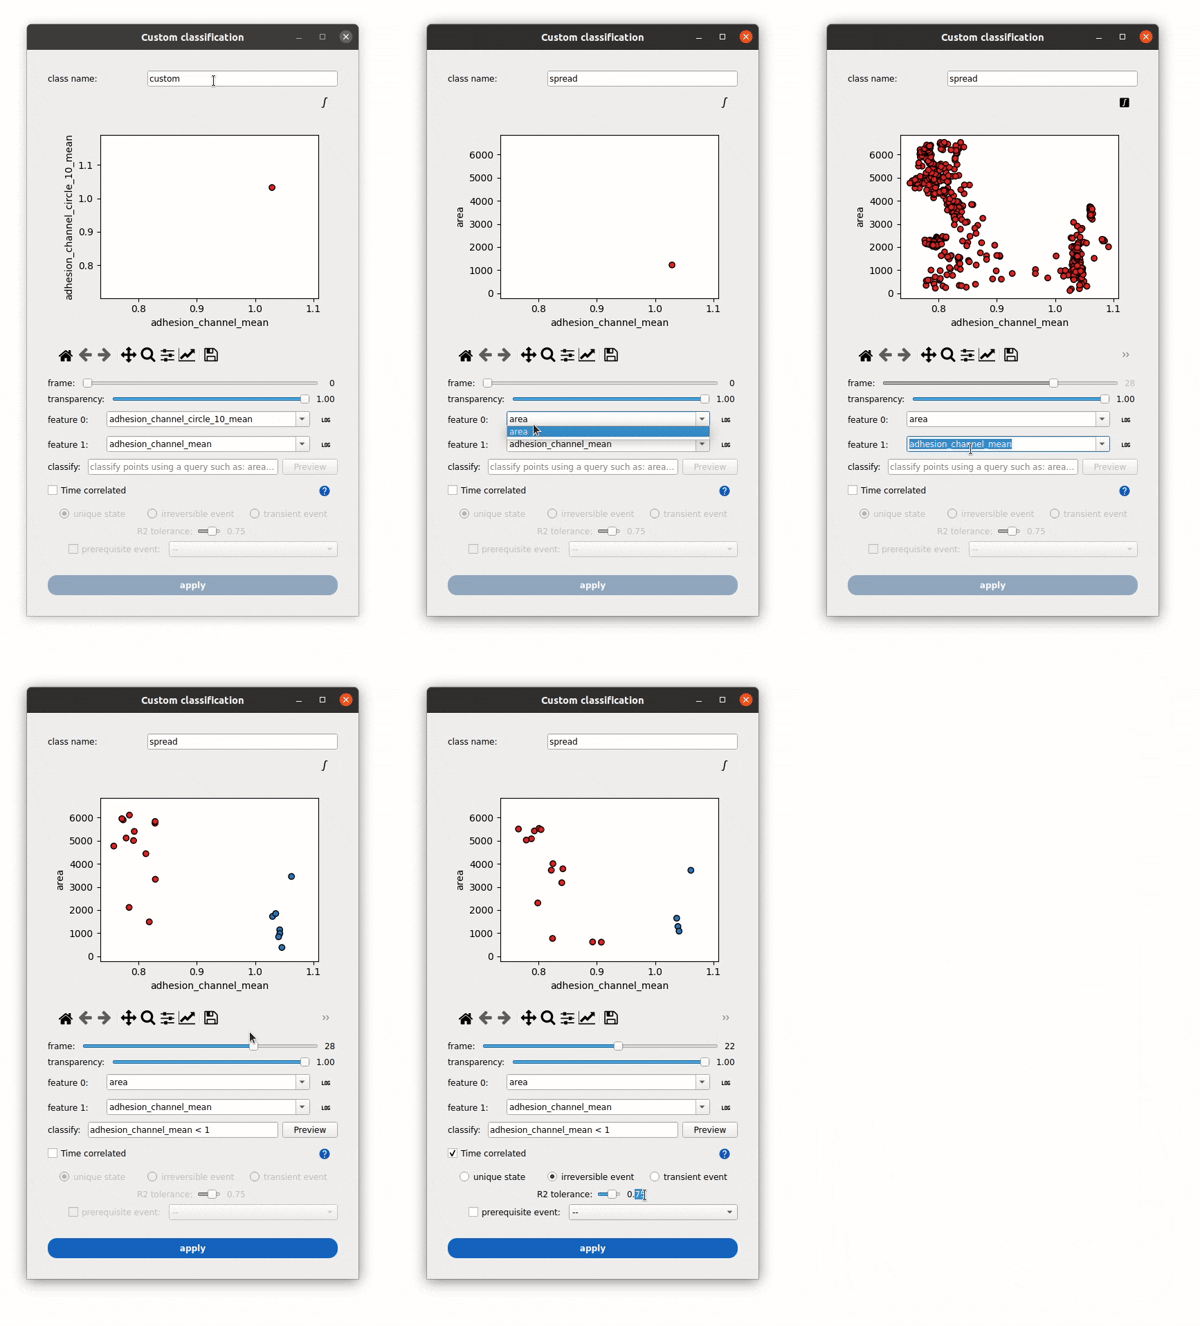
Condition-based spreading event detection
Set class name to
spreading.In the classify field, type
intensity_mean < 1.Check Time correlated and select irreversible event.
Click apply to detect this event for all tracks.
Reopen the Event Annotator (Step 5) to see the vertical lines marking the spreading time.
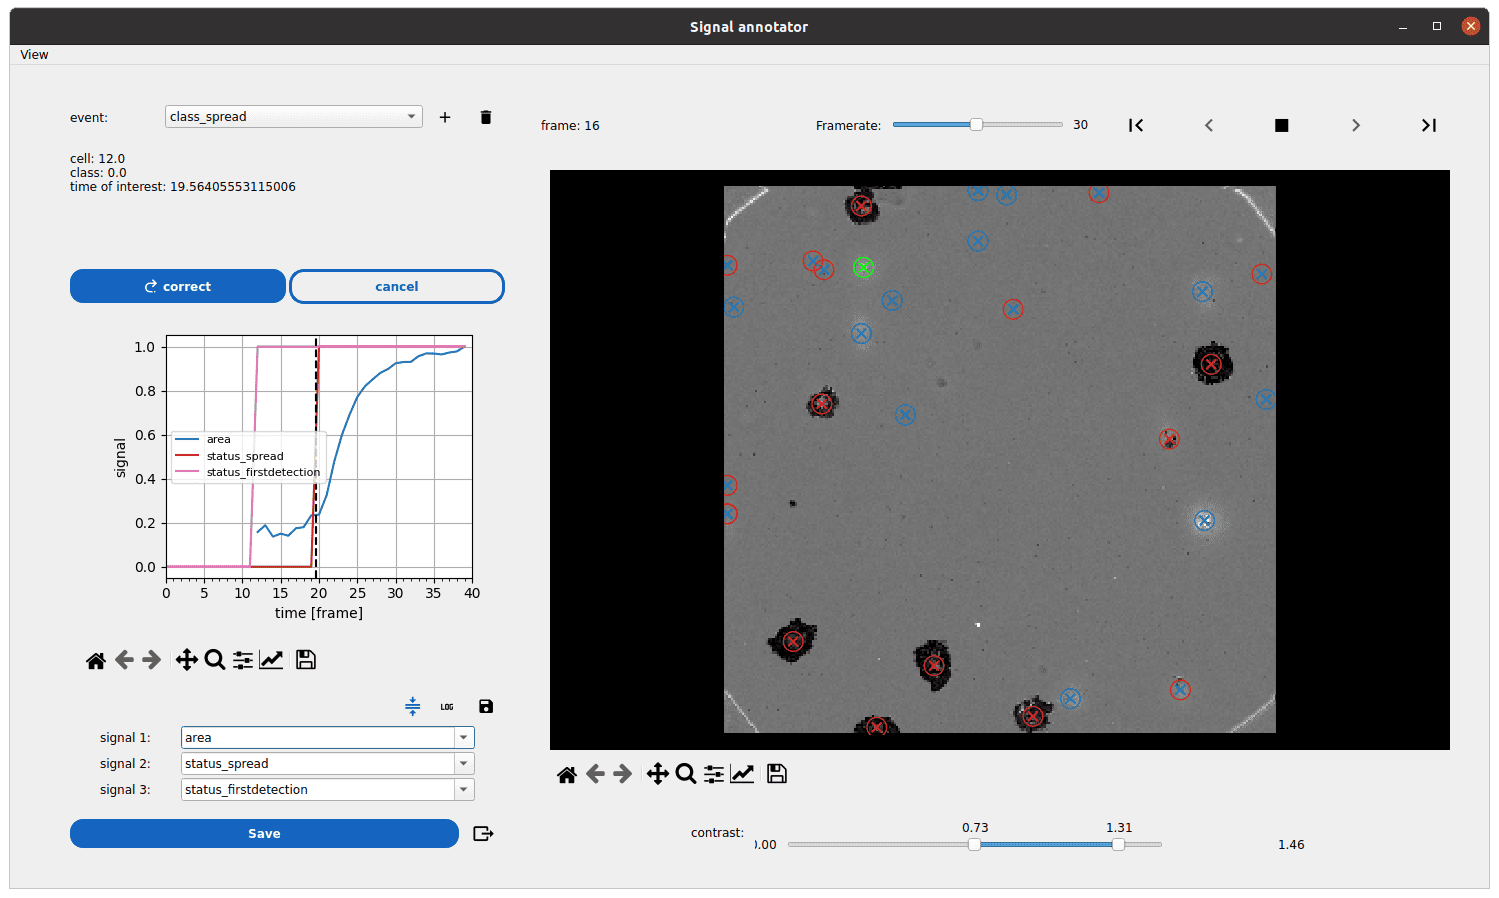
Exploring the spreading event just computed
Step 6: Explore Results
You can now use dedicated tools to analyze your data:
Survival Analysis: Represent the probability of a cell to stay in a hovering state after it appears, over time, using the Survival Plot (start event: first detection, end event: spreading).
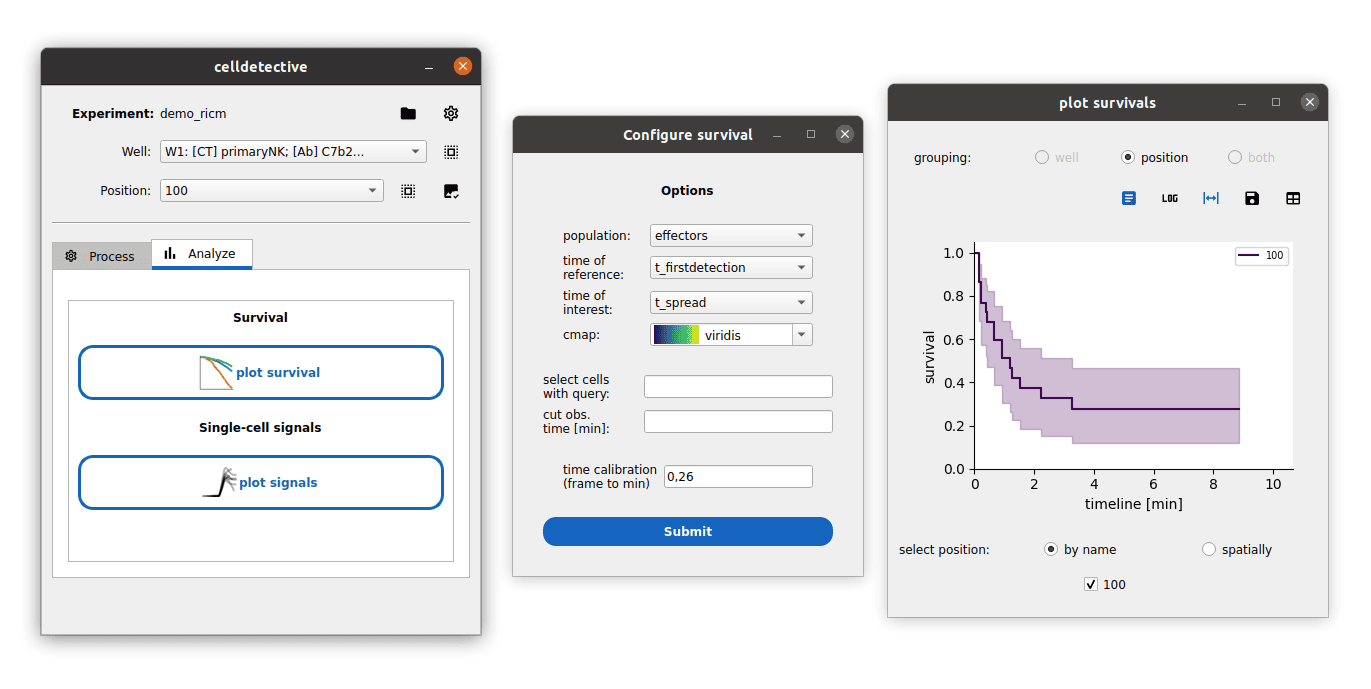
Survival analysis on the spreading assay data
Table Exploration: Inspect feature distributions with the Table Explorer.
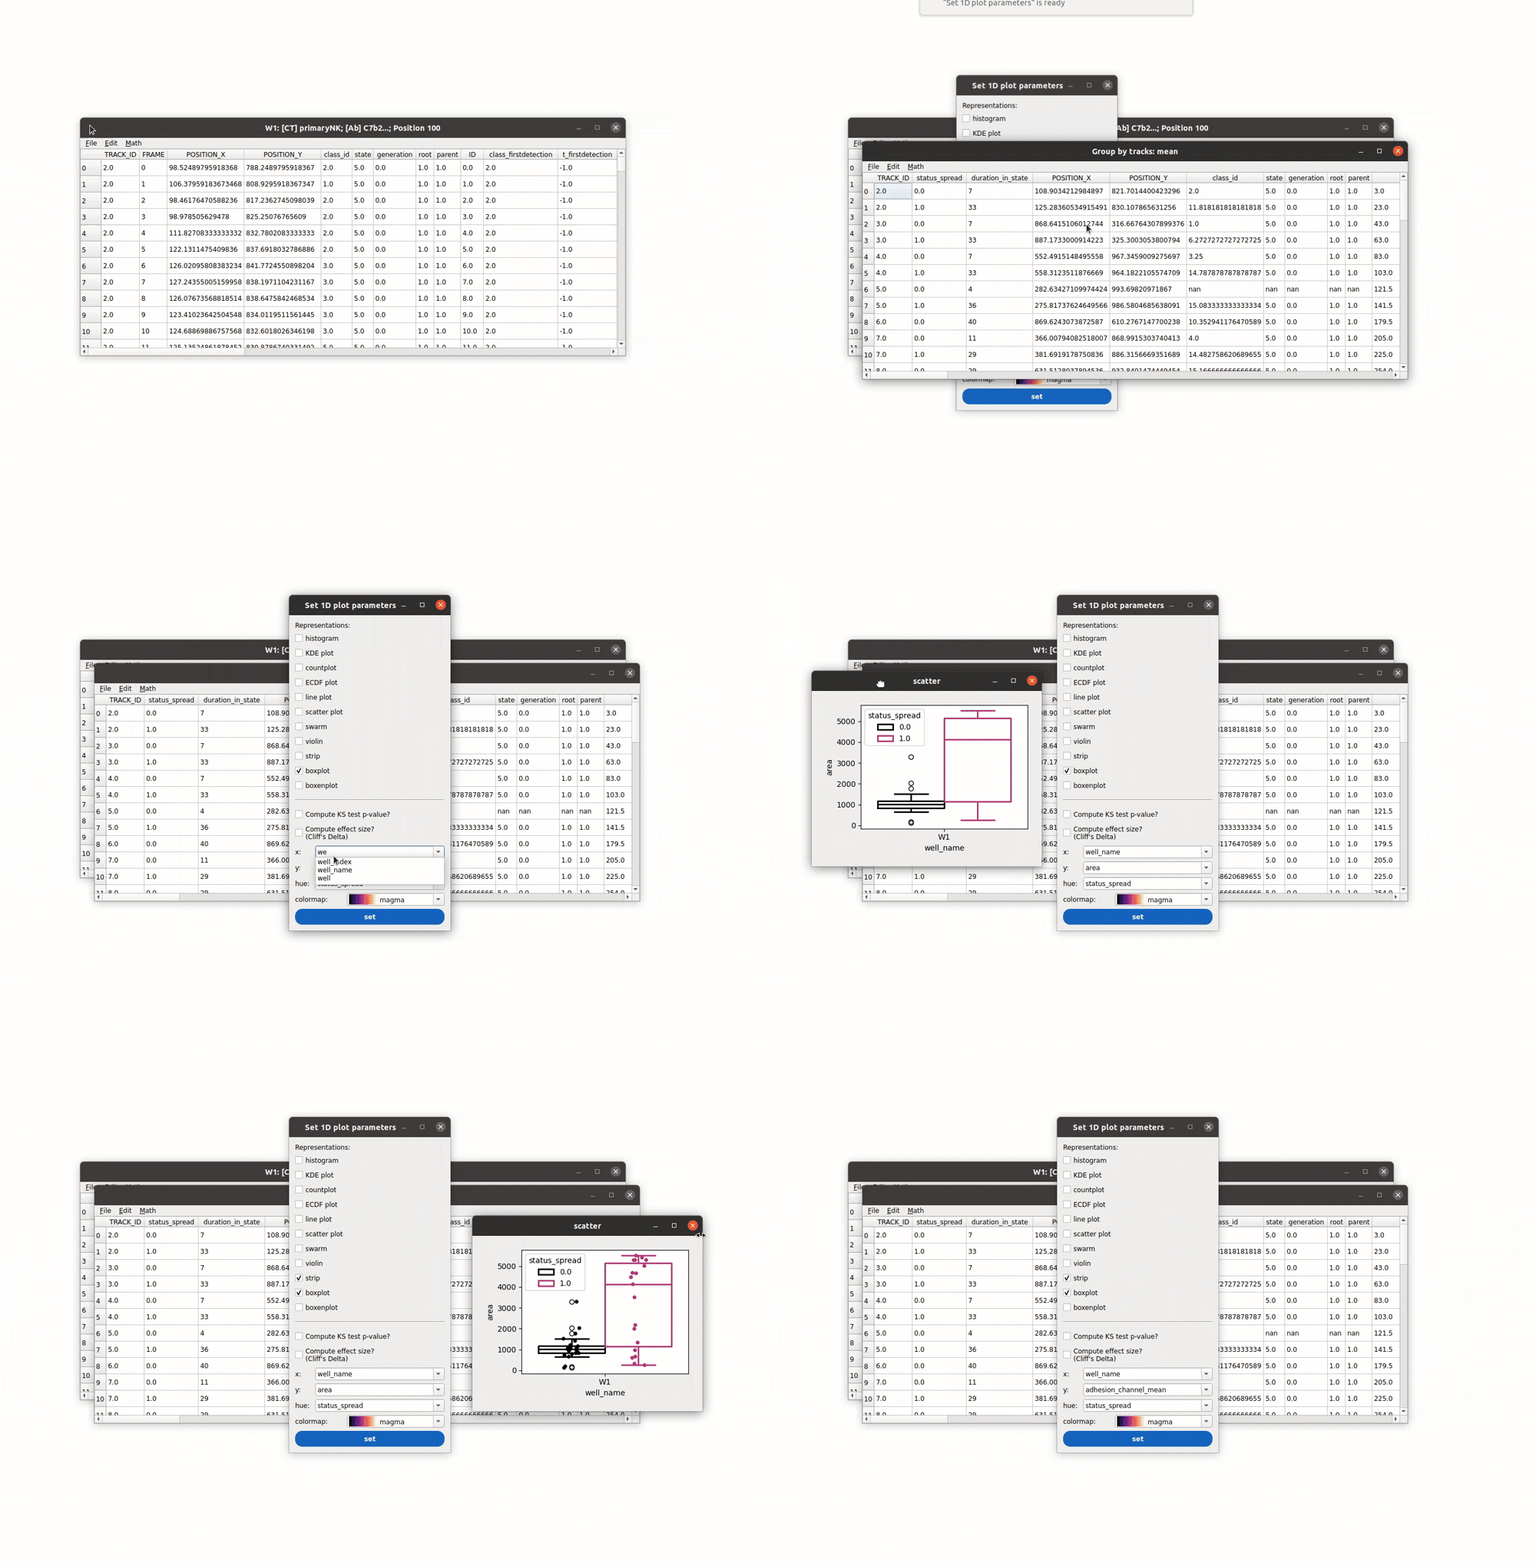
Explore the single-cell data to derive figures
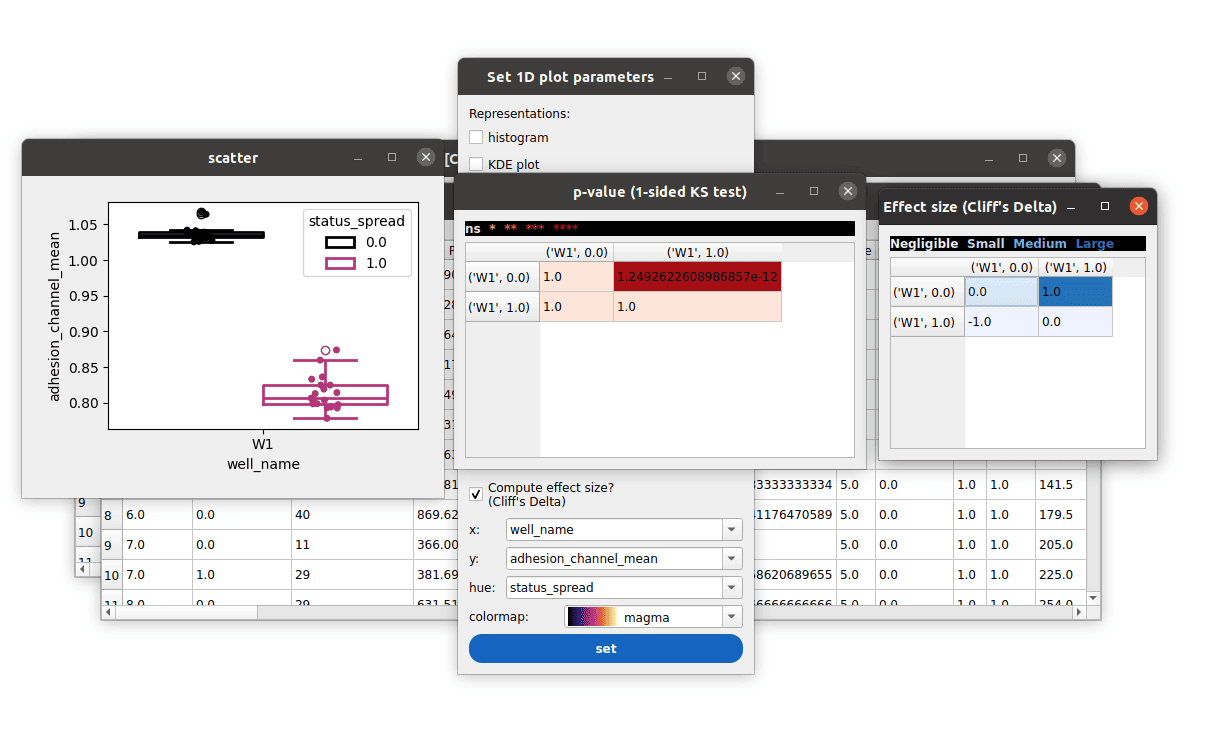
You can even perform standard statistical analysis on the data
Congratulations! You have successfully processed your first experiment.
Next Steps
Learn how to create your own experiment.
Try conditional classification to identify cell states.
Explore measurement options.