UI Menus & Shortcuts
This reference lists the available menu actions and keyboard shortcuts for various Celldetective interfaces.
Table Explorer
File Menu
Save as… (Ctrl+S): Export table to CSV.
Save inplace…: Overwrite the original source file.
Plot… (Ctrl+P): Open the Plotting Interface.
Plot instantaneous… (Ctrl+I): Toggle row-selection plotting for track signals.
Collapse tracks… (Ctrl+G): Open the Track Collapsing dialog.
Collapse pairs in neighborhood…: Aggregate interaction data (Pair tables only).
Group by frames… (Ctrl+T): Aggregate data by time frame.
Query…: Filter rows using Pandas query syntax.
Edit Menu
Delete… (Del): Delete selected columns.
Rename…: Rename the selected column.
Math Menu
Calibrate… (Ctrl+C): Multiply a column by a factor.
Merge states…: Combine multiple status columns.
Differentiate… (Ctrl+D): Compute derivatives (e.g., speed from position).
Options: Window size, Mode (forward/backward/central).
Absolute value…: Compute
abs(x).Log (decimal)…: Compute
log10(x).Bin…: Create a discretely binned column from a continuous measurement. This property natively scales 1D and 2D Histograms matching defined intervals.
Arithmetic: Add, Subtract, Multiply, or Divide two columns.
Event Annotator
Keyboard Shortcuts
Shortcut |
Action |
|---|---|
Space |
Play / Stop animation |
f |
Jump to First frame |
l |
Jump to Last frame |
Ctrl+P |
Open interactive signal plotter |
Esc |
Cancel cell selection |
Del |
Mark selected cell for deletion (cannot undo) |
n |
Reset cell class to “No Event” |
Mouse Interactions
Left Click (Cell): Select a cell to view its signals.
Left Click (Timeline): Jump to a specific timepoint.
Interactive Plotter
Accessed via Ctrl+P from the Event Annotator.
Keyboard Shortcuts
Shortcut |
Action |
|---|---|
Left / Right |
Shift event time for selected traces |
Ctrl+S |
Save changes |
Mouse Interactions
Click + Drag: Draw a box to select multiple traces (highlighted in red).
Classifier Widget
Controls
Class Name: Name of the output column (e.g.,
status_alive) or event (e.g.,death).Feature X/Y: Select features for the 2D scatter plot.
Log Scale (): Toggle log scale for the corresponding axis.
Project Times (): Toggle between single-frame view and projecting all timepoints.
Frame Slider: Browse through timepoints (when projection is off).
Transparency: Adjust point opacity.
Classification
Query: Pandas-style query string (e.g.,
area > 500 and intensity_mean < 100).Preview: Highlight matching cells in red on the scatter plot.
Apply: Create the classification column.
Time Correlation
Unique state: Cell enters a state and remains in it.
Irreversible event: A definitive transition (sigmoid fit).
Transient event: State can be entered and exited.
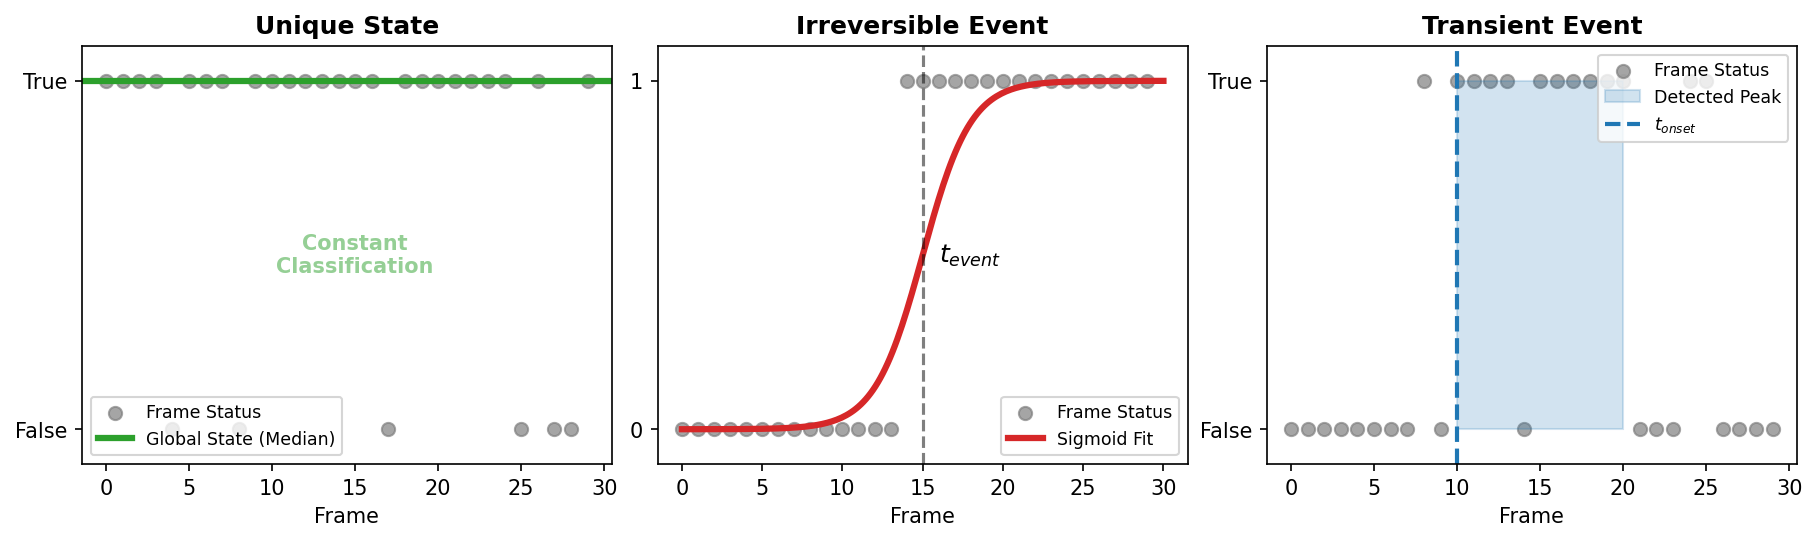
Schematic representation of the different time correlation models.
Prerequisite event: Condition must occur after another specified event.
Phenotype Annotator
Controls
Phenotype: The integer label ID (e.g., 0, 1, 2) to assign to the selected cell for the active Characteristic Group. This allows you to categorize cells within a specific attribute (e.g., 0 for uninfected, 1 for infected).
Delete cell (): Mark the selected cell for deletion.
Add/Delete Characteristic Group: Create or remove custom grouping columns (e.g.,
group,group_custom). A Characteristic Group represents a specific attribute or classification scheme, and the Phenotype is the value assigned to a cell for that attribute. Select the active group from the dropdown menu (default isgroup).
Mouse Interactions
Left Click: Select a cell to view/edit its group.
Interaction Annotator
Controls
Neighborhood: Select the neighborhood definition to visualize (e.g.,
prox_15_px).Interaction Event: Select the event class to annotate (e.g.,
contact).Annotation Buttons: * Event: Mark the current timepoint (or time of interest) as the start of the event. * No event: Mark the pair as having no event. * Else: Mark as “else” (ambiguous or other). * Mark for suppression: Flag the pair for removal.
Time of interest: Manually specify the frame number for the event.
Signal Visualization
Reference / Neighbor / Pair: Select signals to plot for the reference cell, neighbor cell, and the pair itself (e.g., distance).