Analysis
After detecting events and computing measurements, the Analyze tab provides tools for visualizing population-level behavior — collapsing single-cell signals into population means, generating survival curves, and exploring data tables.
Mean signal response
This module collapses single-cell signal traces into population averages, aligned to a reference event time. A cell population and an event class are selected to segregate the cells, followed by the signal to plot. In multi-position mode, mean traces (± standard deviation) are generated for each position, and a pooled trace aggregates all cells. Cells can be filtered by whether they experienced the event or not.
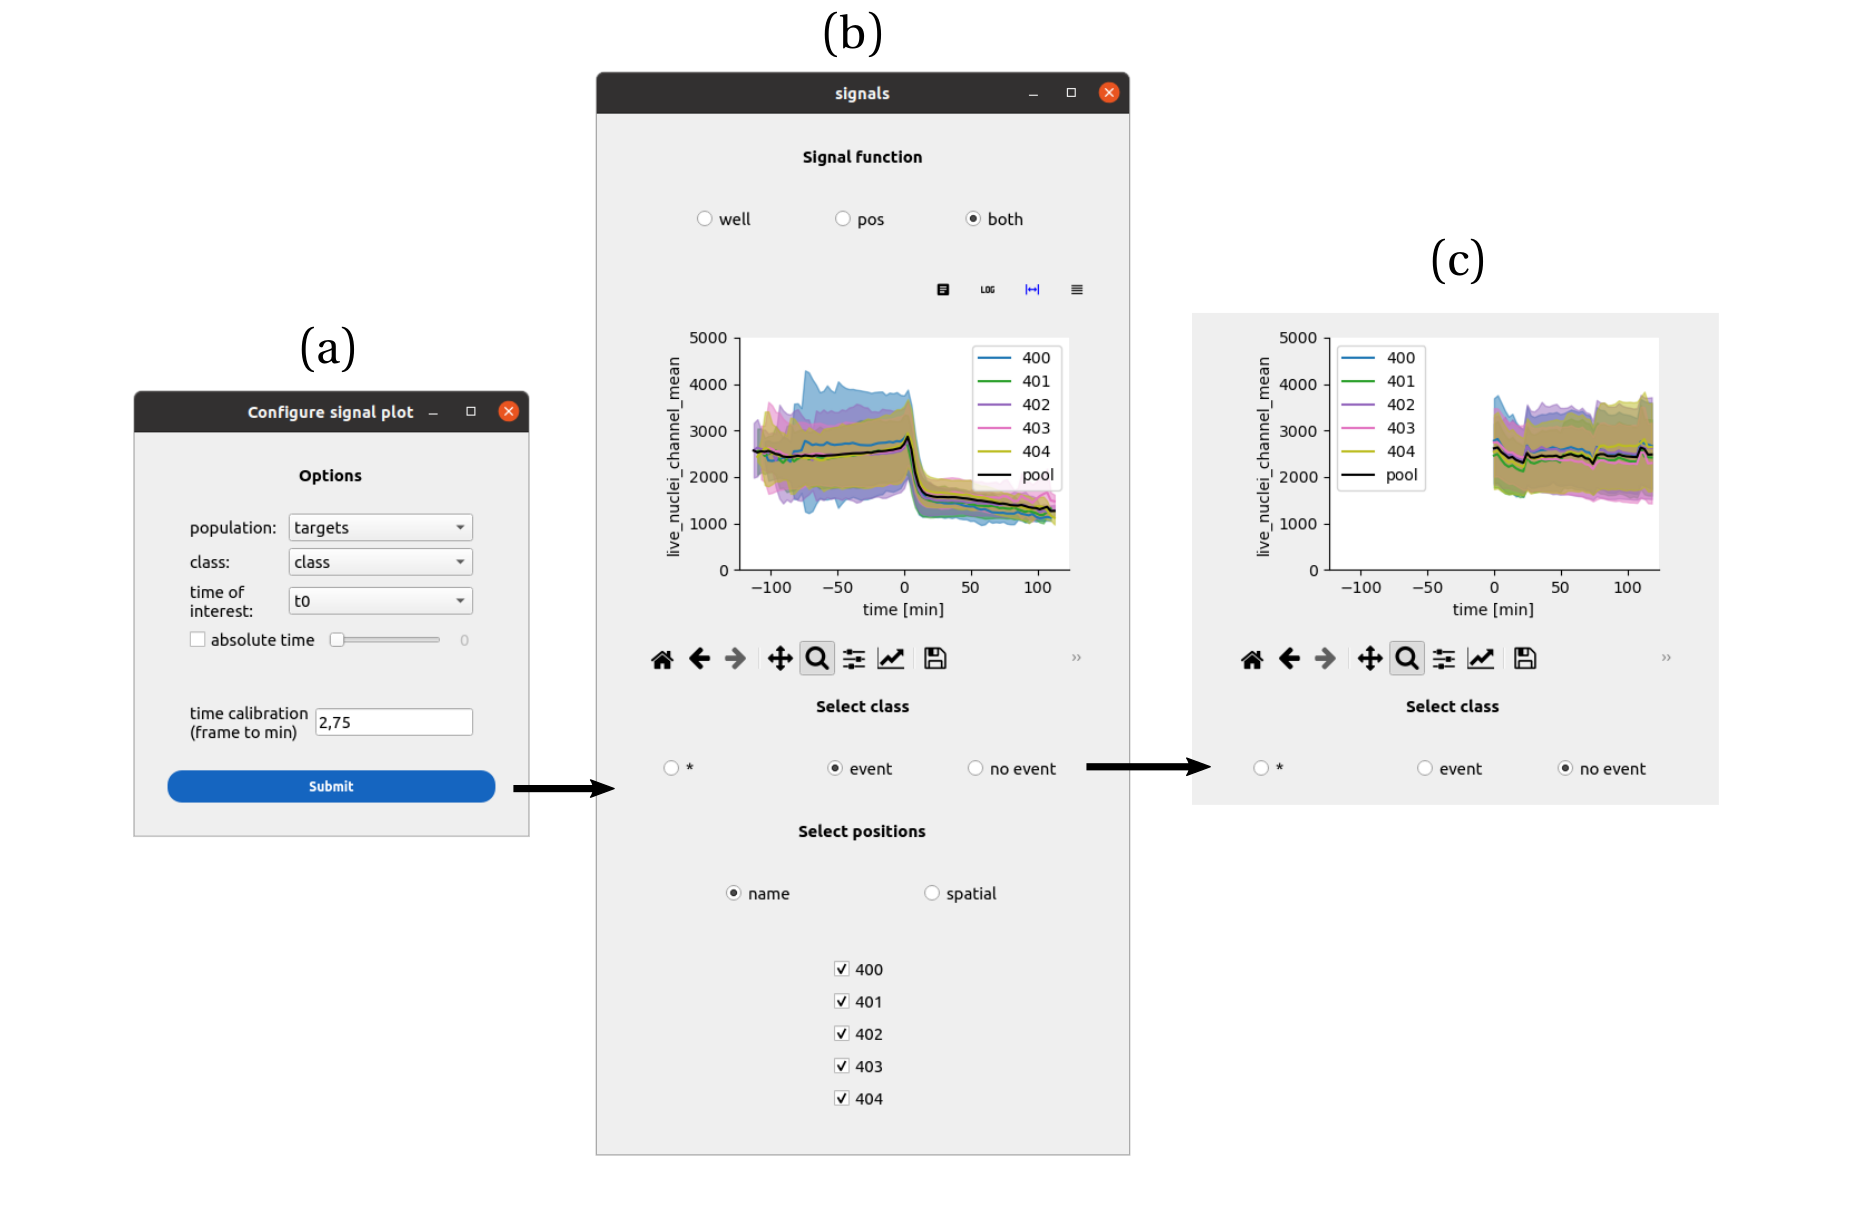
An interface to collapse signals with respect to events. a) The cell population, class to segregate the cells and time of the event is set. Upon submission, a second window asks to select a single signal among the signals measured for that cell population. The control panel header informs about the data selection, between a single position, multiple positions and multiple wells. b) In multiple position mode, the mean signal trace (plus or minus the standard deviation) is generated for each position, as well as a pool trace pooling cells from all positions. The cells can be filtered between the ones that experienced the event (b) and the ones that did not (c), affecting the mean traces.
See also
How to synchronize single-cell timeseries over a population for a step-by-step guide.
Survival analysis
This module generates Kaplan-Meier survival curves between two events. A start event (time of reference) and an end event (time of interest) are defined. The curves are displayed per position with 95% confidence intervals and pooled per well. In multi-well mode, pooled curves for each condition can be compared side by side.

An interface to represent survival functions at multiple scales. a) An analysis module pilots the making of survival functions. A cell population of interest is set, a reference time and an event time are picked from the list of events available for that population. The control panel header informs about the data selection, between a single position, multiple positions and multiple wells. b) In multiple-positions mode, each position’s survival function is plotted with its 95 % confidence interval, as well as the pooled survival function for the well. Positions can be added or removed from the plot. c) In multiple-wells mode, individual positions are still shown but without the 95 % confidence interval. Emphasis is put on the pooled survival functions that can be compared across wells. As before, wells can be added or removed from the plot.
See also
How to plot survival between two events for a step-by-step guide. | Survival Analysis Settings for parameter details.
Data exploration
For a detailed guide on interacting with per-cell data tables, performing calculations, and collapsing tracks, see the table_exploration page and the How to compare collapsed measurements across conditions guide.